What leads operators to the RabbitMQ management UI
Any Magento 2 store using async processing — async order export, async catalogue sync, async image conversion — depends on RabbitMQ staying healthy. When a queue backs up, or a consumer dies, or a message rate collapses, the first sign is usually a late order or a missing product update. By that point, the damage is done.
The standard response is to open the RabbitMQ management UI: a separate web interface running on a different host and port, protected by credentials most operators don’t have bookmarked. For developers this is a minor context switch. For operations and support staff, it is an obstacle that delays diagnosis.
The AMQP Monitor module brings RabbitMQ visibility directly into the Magento 2 admin — no separate credentials, no URL to remember, no context switch.
Impact Callout
A read-only admin panel page that shows your RabbitMQ server version, connection configuration, and live queue statistics — ready/unacked counts, message rates, queue state — alongside configurable notifications for queue states that signal a processing problem.
What the monitor shows
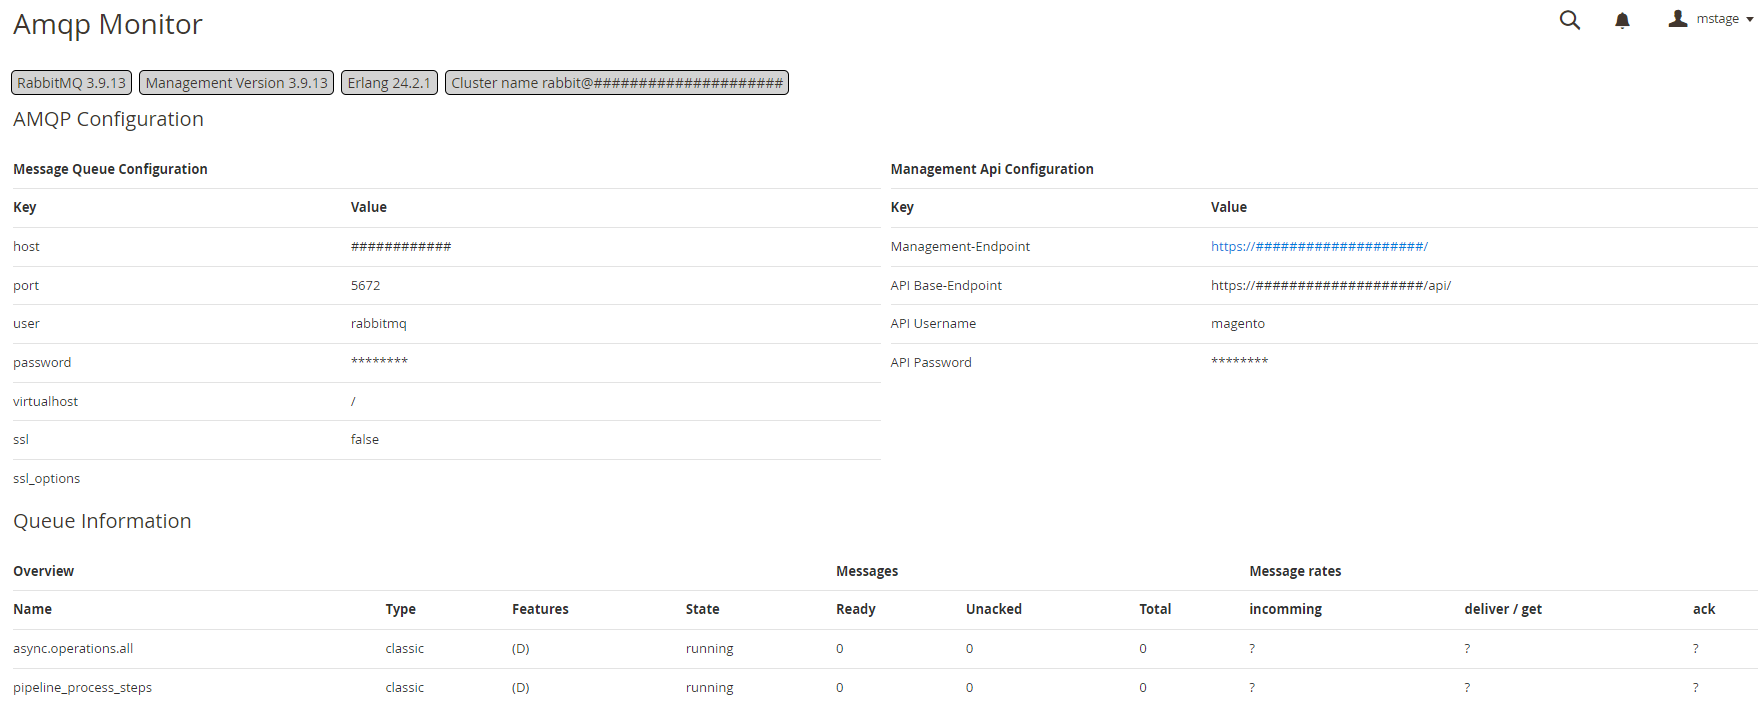
The monitor page is at System → Tools → BroCode AMQP Monitor.
Server summary — version badges at the top of the page show the RabbitMQ server version, management plugin version, Erlang/OTP version, and cluster name. Useful for confirming which environment you’re looking at.
AMQP configuration — the left-hand table displays the active queue/amqp connection settings from Magento’s deployment configuration: host, port, AMQP user, virtual host, and SSL mode. Sensitive values are masked.
Management API configuration — the right-hand table shows the management endpoint URL and API credentials configured in the module settings.
Queue information — a table listing all queues the RabbitMQ management API reports:
| Column | What it shows |
|---|---|
| Name | Queue name as registered in Magento or RabbitMQ directly |
| Type | classic or quorum |
| Features | Persistence flags (D = durable) |
| State | running, idle, or down |
| Ready | Messages waiting to be consumed |
| Unacked | Messages delivered to a consumer but not yet acknowledged |
| Total | Ready + Unacked |
| Incoming rate | Messages arriving per second |
| Deliver/get rate | Messages leaving per second |
| Ack rate | Acknowledgements per second |
A non-zero Unacked count that grows over time is the clearest signal of a consumer problem. A Ready count that climbs while the deliver rate stays at zero means nothing is consuming.
Notifications
The module ships configurable notification rules under Stores → Configuration → Services → Amqp Monitor → Notifications. Each rule watches one queue and one metric, and fires when the threshold is crossed:
| Trigger | What it catches |
|---|---|
| Ready count above N | Queue backing up — consumers too slow or stopped |
| Unacked count above N | Consumer stuck mid-processing |
| Deliver rate at zero | Nothing consuming despite messages waiting |
State is down | Queue unavailable |
Notifications surface in the Magento admin notification bell. No email or external webhook — the goal is visibility for an operator already in the admin, not a full alerting pipeline.
CTA Bar
Who For
- Operations teams running async Magento workloads (order export, catalogue sync, image optimisation) who need queue health visible without a separate RabbitMQ management login.
- Developers who want a quick sanity check on consumer throughput — is the queue actually draining, or silently stalled?
- Support teams who lack RabbitMQ credentials or access to the
:15672management UI but need to confirm whether a processing delay is queue-related.
Who Skip
- Stores not using RabbitMQ. If
queue/amqpis not configured in Magento’senv.php, there is nothing for this module to connect to. - Teams with mature external monitoring (Prometheus + Grafana, CloudWatch, Datadog) already alerting on RabbitMQ metrics. The module adds admin-panel visibility, not a replacement for dedicated monitoring infrastructure.
Installation
composer require brocode/module-amqp-monitor
bin/magento module:enable Brocode_AmqpMonitor
bin/magento setup:upgrade
bin/magento cache:flush
No database schema changes. The monitor page appears under System → Tools → BroCode AMQP Monitor immediately after setup.
Configuration
Under Stores → Configuration → Services → Amqp Monitor:
| Setting | Description |
|---|---|
| Management Endpoint | Full URL of the RabbitMQ management API, e.g. https://amqp-management.example.com/api/ |
| BasicAuth Username | API user — defaults to the AMQP connection username if left empty |
| BasicAuth Password | API password — defaults to the AMQP connection password if left empty |
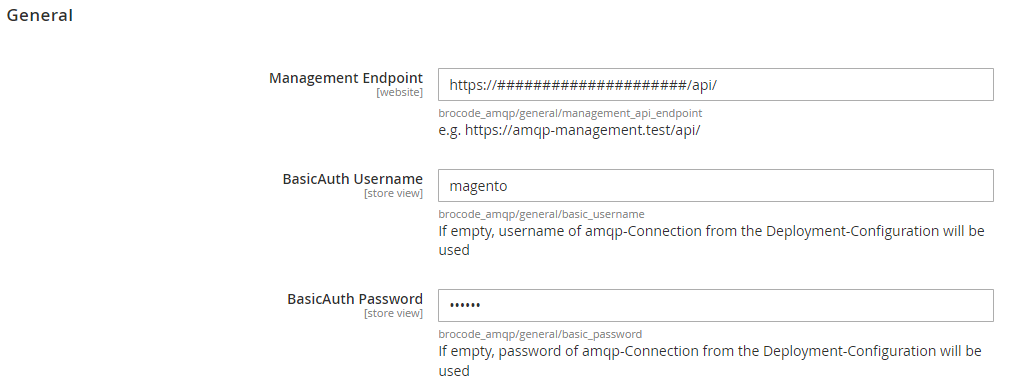
The RabbitMQ management plugin must be enabled (rabbitmq-plugins enable rabbitmq_management). The API user needs at least the monitoring tag in RabbitMQ.
Compatibility
| Magento version | PHP | Status |
|---|---|---|
| 2.4.6 | 8.1 / 8.2 / 8.3 | Stable |
| 2.4.5 | 8.1 / 8.2 | Stable |
| 2.4.4 | 8.1 | Stable |
Requires RabbitMQ with the management plugin enabled.
FAQ
Does the module store queue data in Magento’s database?
No. Queue statistics are fetched live from the RabbitMQ management API on every page load. Nothing is persisted — the view is always current.
Do I need the RabbitMQ management plugin?
Yes. The module connects to the HTTP management API that the plugin exposes. If the plugin is not active, the monitor page will report a connection error.
What RabbitMQ permissions does the API user need?
The monitoring tag in RabbitMQ grants read access to the management API without write privileges. A dedicated monitoring user is recommended over using the full admin credentials.
Does it work with RabbitMQ clusters?
Yes. The management API exposes cluster metadata (cluster name, node versions), which the module displays in the server summary section. Queue stats are aggregated across the cluster by the management API.
Can I use it with the MySQL queue instead of RabbitMQ?
No. This module connects specifically to the RabbitMQ management API. For MySQL queue monitoring, the queue stats are visible in the Magento admin under System → Action Logs or via the brocode/module-image-optimizer-queue consumers.
How do I investigate what a failing consumer was doing?
The monitor shows queue-level health but not per-message log lines. For that, install Magento 2 Log Tracing — it stamps every log line a consumer process writes with a shared trace ID, so you can grep for the ID from a specific consumer run across var/log/ and reconstruct exactly what happened.